NALFA recently released the results from its 2021 Litigation Hourly Rate Survey. The results, published in The 2021 Litigation Hourly Rate Survey & Report, contains billing rate data on the factors that correlate directly to hourly rates in litigation: geography, years of litigation experience, complexity of case, and litigation practice size.
This empirical survey and report provides macro and micro data of defense and plaintiffs’ rates in regular and complex litigation, at various litigation experience levels, from large law firms to solo shops, and in the nation’s largest markets. This is the nation’s largest and most comprehensive survey or study on hourly billing rates in litigation.
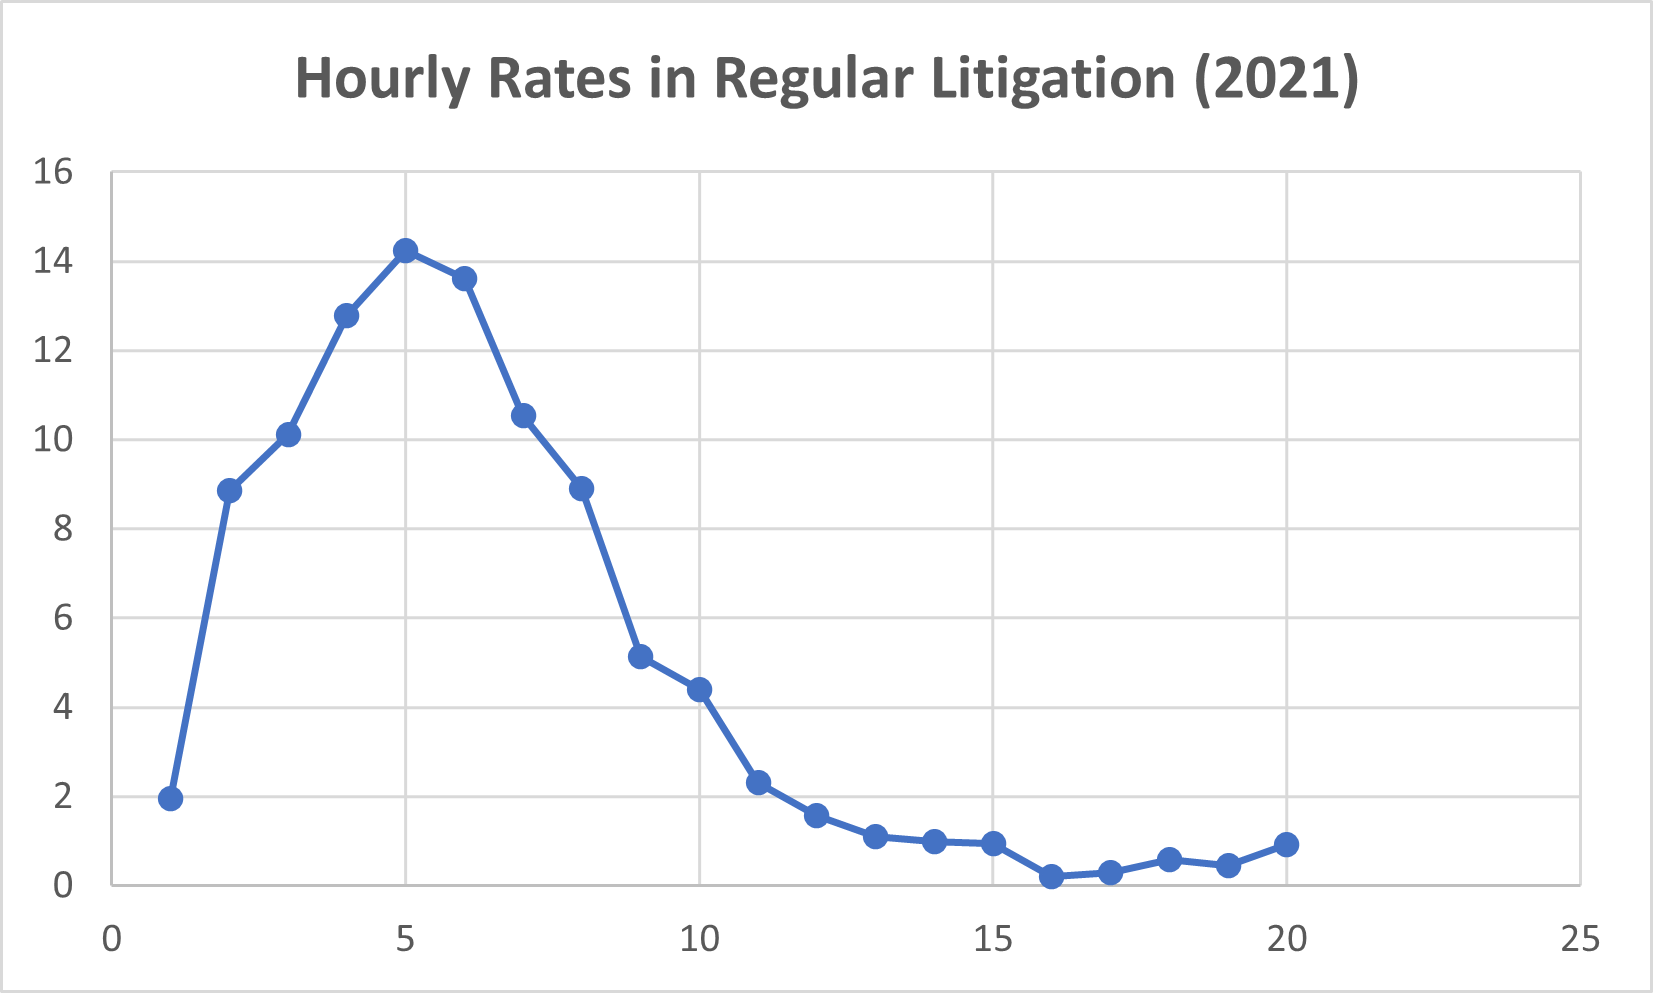
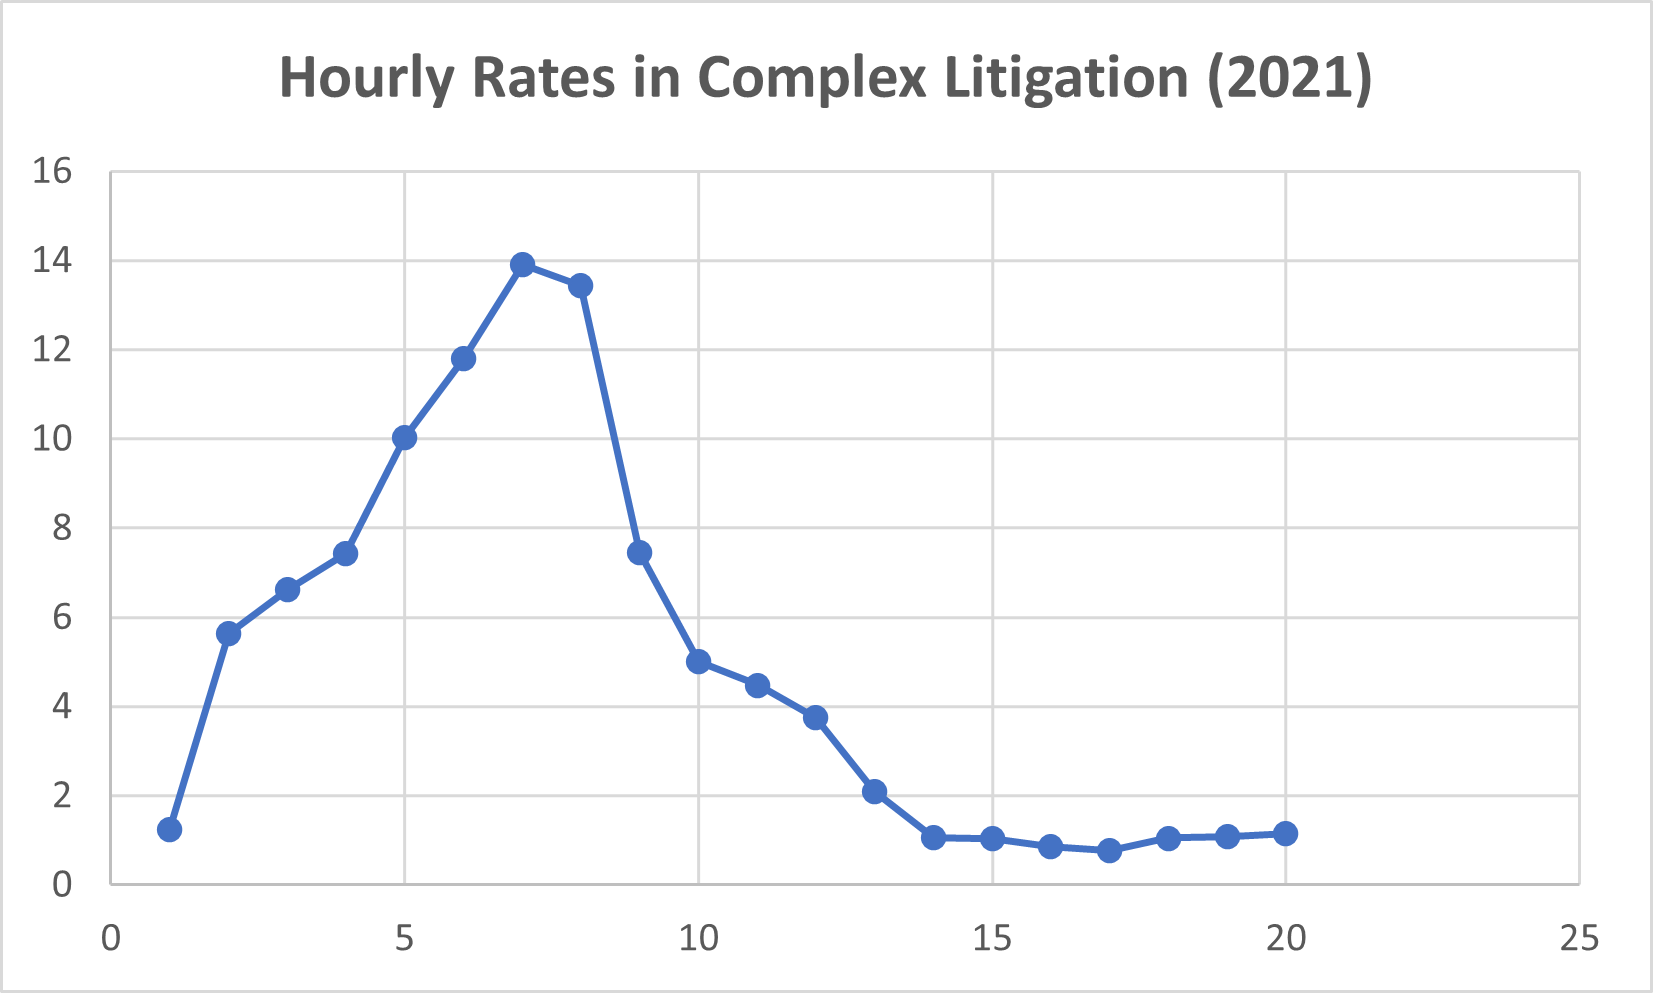
Over 8,400 qualified litigators fully participated in this hourly rate survey. When we plot all responses (plaintiffs' and defense) on a graph (x,y axis), we have a general shape distribution model known as chi-squared distribution. That is, the distribution is not the classic bell-shaped curve.
Our model here starts from a low point ($200-$250), peaks before the midpoint ($601-$650), then declines gradually and finishes with a long tail with an uptick at the very end (Over $1100). It resembles a whale-shaped type distribution. In the graph below, the y axis is the percentage of responses and the x axis is the hourly rate scale (Less than $200 to Over $1100).


